

A dashboard showing one thousand posts about a health topic can be useful to a community manager. It shows that a collection of messages met a particular search rule. It does not necessarily show one thousand people, one thousand patients or one thousand independent opinions.
The difference matters when social listening moves into health discussion. A question about a peptide, a news headline and a personal account can all contain the same keyword. Counting them together may describe attention, but it cannot establish the frequency of a condition or the effectiveness of an intervention.
Decide what one row represents
Before creating a chart, define the unit being counted. It might be a post, an account, a conversation thread, a link or a coded statement. These units can overlap, but they are not interchangeable.
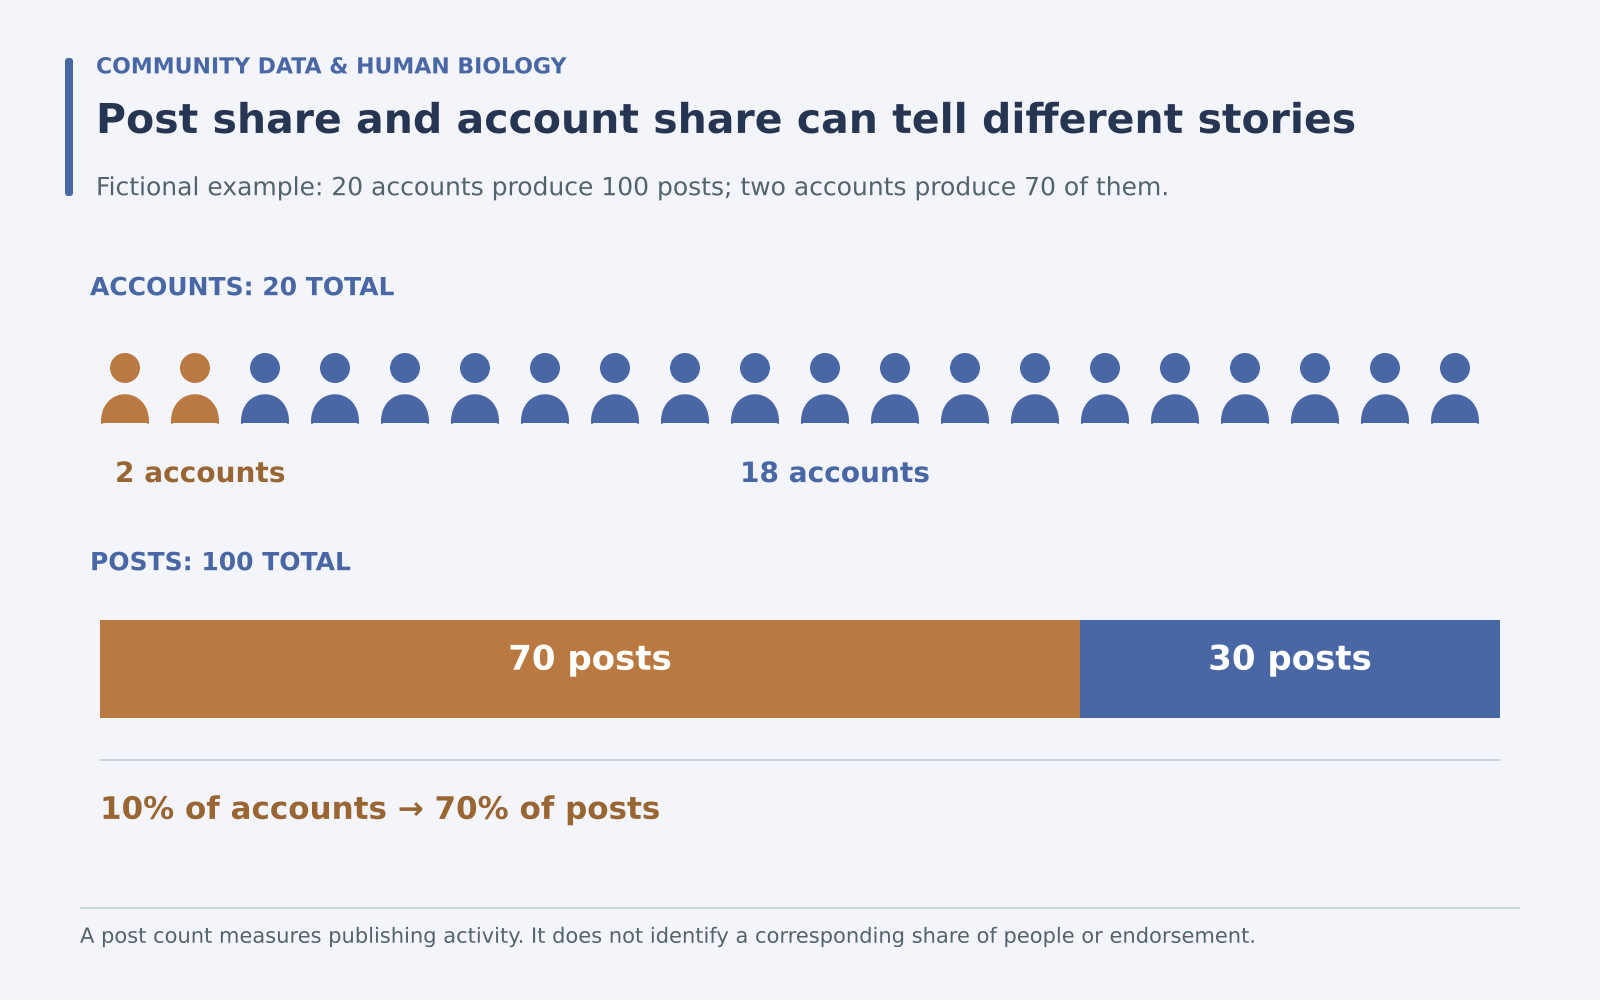
Imagine a fictional collection of one hundred posts from twenty accounts. Two accounts produce seventy of the posts, and the other eighteen produce thirty. The post count describes publishing activity. The account count describes the visible accounts represented. Neither directly establishes how many distinct people are behind them.
If the chart title says “people discussing recovery,” the label has already moved beyond the observed unit. “Posts matching the recovery query” is less dramatic and more informative because readers can understand what was counted.
Write down the collection rule
The AAPOR disclosure standards identify the unit of analysis, data source and collection dates as information needed to understand content analyses. These details make a reported result inspectable rather than leaving readers with an unexplained total.
For a small editorial project, a collection note can be simple: platform, date window, search terms, languages included, treatment of reposts and reason for exclusions. Preserve the exact version of the query used for each period.
The word stress offers an obvious example. It can refer to psychological strain, a mechanical load, a linguistic emphasis or a laboratory condition. A health-focused search needs a rule for distinguishing those uses, and the rule should be checked against actual examples.
Separate attention from endorsement
A person can mention a product because they recommend it, question it, criticize it or quote somebody else. A link may lead to an original study, a sales page, a news story or an unrelated use of the same abbreviation.
For a fictional peptide discussion, useful content categories might include a request for a definition, a question about a study, a personal report, a commercial message and an unclear reference. The categories should match the question being studied rather than forcing every post into positive or negative sentiment.
A quotation can make automated sentiment particularly misleading. The phrase “this claim is wonderful” could be sincere, sarcastic or part of an example being criticized. When the meaning is uncertain, retain an uncertain category instead of assigning confidence that the text does not support.
Automation changes the meaning of volume
A 2018 Pew Research Center analysis of automated accounts examined how suspected bots shared links on Twitter. It provides a historical example of why a large volume of posts cannot automatically be interpreted as an equally large number of independent human contributions.
The study’s setting and period should remain attached to its findings. It is not a current estimate of automation on every platform or within a particular health community. Its methodological lesson is narrower: account behaviour belongs in the interpretation of posting activity.
For a new dataset, use only the distinctions you can support. “Repeated identical text” is an observable feature. “Bot” is a classification that needs a defined method. A high posting rate alone does not reveal a person’s identity or motives.
Choose a denominator that answers the question
A count describes volume. A share describes one part of a defined collection. If twenty of one hundred collected posts are questions, the share is twenty percent. That is a statement about the collected posts, not about every member of the community.
Now imagine that the following period contains thirty questions among three hundred collected posts. There are more questions in absolute terms, but their share falls to ten percent. Both observations can be true. A chart should identify which one matters for the editorial decision.
| Metric | What it describes | What it does not establish |
|---|---|---|
| Matching posts | Observed publishing volume | Number of patients |
| Distinct accounts | Accounts appearing in the collection | Distinct verified people |
| Share coded as questions | Composition of the collected material | Prevalence of uncertainty in a population |
Check whether periods are comparable
A rise can reflect more interest, a news event, different collection access or a changed query. If you add a popular abbreviation halfway through a series, later totals may include material that earlier totals could never capture.
Keep a small change log beside the chart. Record modifications to search terms, classification rules and available data. If the collection method changes substantially, show the break in the series rather than presenting a continuous trend as though the measurements were identical.
Also distinguish event-driven bursts from sustained discussion. One heavily shared headline can dominate a short window. Reading the leading repeated links often reveals what the volume represents more clearly than a broad sentiment label.
Use the findings for an appropriate editorial task
Social listening can identify recurring language, confusing terms and questions worth explaining. If a community repeatedly asks whether ACTH and cortisol are the same molecule, that is a concrete opportunity for an educational article.
The observation does not demonstrate that the community has a hormonal disorder. It shows that the collected discussion contains a terminology question. Matching the response to that finding avoids turning a useful communication tool into an unsupported diagnostic instrument.
Publish aggregated examples where possible and avoid exposing unnecessary identifying details from individual health accounts. A fictional example can often illustrate a wording problem without reproducing someone’s sensitive story.
Label the final chart honestly
A useful caption states the counted unit, date window, source and main selection rule. Add the most important limitation close to the result, especially if the collection was self-selected or incomplete.
The goal is a dashboard that supports decisions its data can actually inform. Posts can reveal what was said, how often a term appeared and where explanations may help. Keeping those observations distinct from people, diagnoses and treatment outcomes makes social health analysis both clearer and more useful.
 English